The interval between checkpoints, K, was 128 requests, which causes garbage collection to occur several times in each experiment. The size of the log, L, was 256. The state partition tree had 4 levels, each internal node had 256 children, and the leaves had 4 KB.
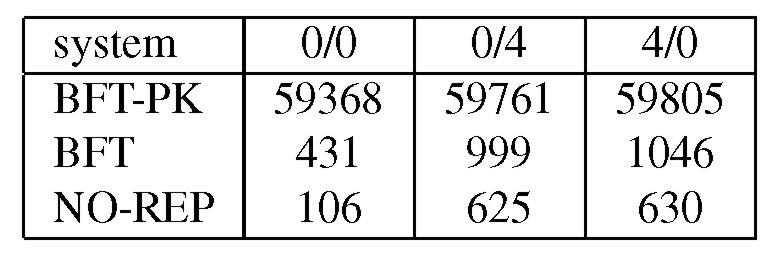
Table 1 reports the latency to invoke an operation when the service is accessed by a single client. The results were obtained by timing a large number of invocations in three separate runs. We report the average of the three runs. The standard deviations were always below 0.5% of the reported value.
BFT-PK has two signatures in the critical path and each of them takes 29.4 ms to compute. The algorithm described in this paper eliminates the need for these signatures. As a result, BFT is between 57 and 138 times faster than BFT-PK. BFT's latency is between 60% and 307% higher than NO-REP because of additional communication and computation overhead. For read-only requests, BFT uses the optimization described in [6] that reduces the slowdown for operations 0/0 and 0/4 to 93% and 25%, respectively.
We also measured the overhead of replication at the client. BFT increases
CPU time relative to NO-REP by up to a factor of 5, but the CPU time at
the client is only between 66 and 142s per operation. BFT also increases
the number of bytes in Ethernet packets that are sent or received by the
client: 405% for the 0/0 operation but only 12% for the other operations.
Figure 5 compares the throughput of the different implementations of the service as a function of the number of clients. The client processes were evenly distributed over 5 client machines2 and each client process invoked operations synchronously, i.e., it waited for a reply before invoking a new operation. Each point in the graph is the average of at least three independent runs and the standard deviation for all points was below 4% of the reported value (except that it was as high as 17% for the last four points in the graph for BFT-PK operation 4/0). There are no points with more than 15 clients for NO-REP operation 4/0 because of lost request messages; NO-REP uses UDP directly and does not retransmit requests.
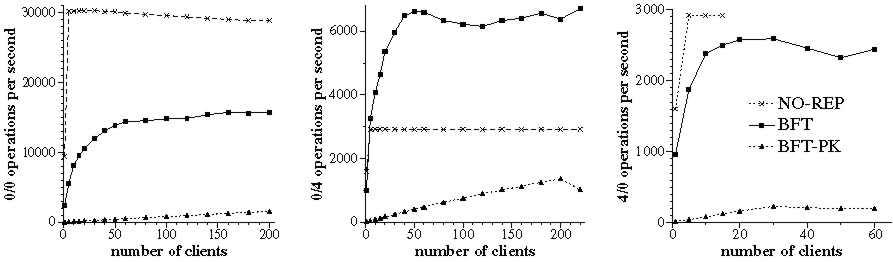
The throughput of both replicated implementations increases with the number of concurrent clients because the library implements batching [4]. Batching inlines several requests in each pre-prepare message to amortize the protocol overhead. BFT-PK performs 5 to 11 times worse than BFT because signing messages leads to a high protocol overhead and there is a limit on how many requests can be inlined in a pre-prepare message.
The bottleneck in operation 0/0 is the server's CPU; BFT's maximum throughput is 53% lower than NO-REP's due to extra messages and cryptographic operations that increase the CPU load. The bottleneck in operation 4/0 is the network; BFT's throughput is within 11% of NO-REP's because BFT does not consume significantly more network bandwidth in this operation. BFT achieves a maximum aggregate throughput of 26 MB/s in operation 0/4 whereas NO-REP is limited by the link bandwidth (approximately 12 MB/s). The throughput is better in BFT because of an optimization that we described in [6]: each client chooses one replica randomly; this replica's reply includes the 4 KB but the replies of the other replicas only contain small digests. As a result, clients obtain the large replies in parallel from different replicas. We refer the reader to [4] for a detailed analysis of these latency and throughput results.
The experiments ran the modified Andrew benchmark [25,15], which emulates a software development workload. It has five phases: (1) creates subdirectories recursively; (2) copies a source tree; (3) examines the status of all the files in the tree without examining their data; (4) examines every byte of data in all the files; and (5) compiles and links the files. Unfortunately, Andrew is so small for today's systems that it does not exercise the NFS service. So we increased the size of the benchmark by a factor of n as follows: phase 1 and 2 create n copies of the source tree, and the other phases operate in all these copies. We ran a version of Andrew with n equal to 100, Andrew100, and another with n equal to 500, Andrew500. BFS builds a file system inside a memory mapped file [6]. We ran Andrew100 in a file system file with 205 MB and Andrew500 in a file system file with 1 GB; both benchmarks fill 90% of theses files. Andrew100 fits in memory at both the client and the replicas but Andrew500 does not.
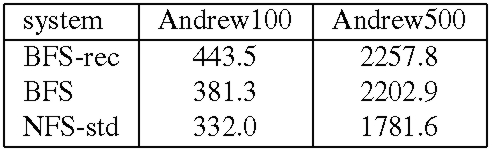
We also compare BFS and the NFS implementation in Linux, NFS-std. The performance of NFS-std is a good metric of what is acceptable because it is used daily by many users. For all configurations, the actual benchmark code ran at the client workstation using the standard NFS client implementation in the Linux kernel with the same mount options. The most relevant of these options for the benchmark are: UDP transport, 4096-byte read and write buffers, allowing write-back client caching, and allowing attribute caching. Tables 2 and 3 present the results for these experiments. We report the mean of 3 runs of the benchmark. The standard deviation was always below 1% of the reported averages except for phase 1 where it was as high as 33%. The results show that BFS-PK takes 12 times longer than BFS to run Andrew100 and 15 times longer to run Andrew500. The slowdown is smaller than the one observed with the micro-benchmarks because the client performs a significant amount of computation in this benchmark.
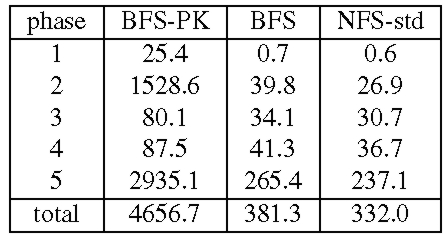
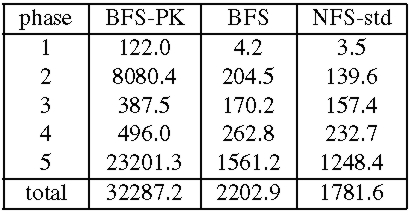
Both BFS and BFS-PK use the read-only optimization described in [6] for reads and lookups, and as a consequence do not set the time-last-accessed attribute when these operations are invoked. This reduces the performance difference between BFS and BFS-PK during phases 3 and 4 where most operations are read-only. BFS-PK is impractical but BFS's performance is close to NFS-std: it performs only 15% slower in Andrew100 and 24% slower in Andrew500. The performance difference would be lower if Linux implemented NFS correctly. For example, we reported previously [6] that BFS was only 3% slower than NFS in Digital Unix, which implements the correct semantics. The NFS implementation in Linux does not ensure stability of modified data and meta-data as required by the NFS protocol, whereas BFS ensures stability through replication.
The implementation of the proactive recovery mechanism is complete except that we are simulating the secure co-processor, the read-only memory, and the watchdog timer in software. We are also simulating fast reboots. The LinuxBIOS project [22] has been experimenting with replacing the BIOS by Linux. They claim to be able to reboot Linux in 35 s (0.1 s to get the kernel running and 34.9 to execute scripts in /etc/rc.d) [22]. This means that in a suitably configured machine we should be able to reboot in less than a second. Replicas simulate a reboot by sleeping either 1 or 30 seconds and calling msync to invalidate the service-state pages (this forces reads from disk the next time they are accessed).
Table 4 presents a breakdown of the maximum time to recover a replica in both benchmarks. Since the processes of checking the state for correctness and fetching missing updates over the network to bring the recovering replica up to date are executed in parallel, Table 4 presents a single line for both of them. The line labeled restore state only accounts for reading the log from disk the service state pages are read from disk on demand when they are checked.
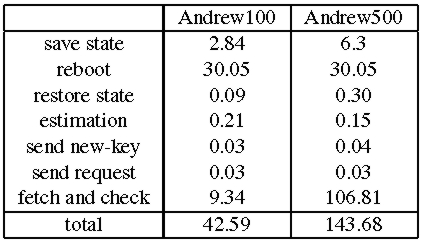
The most significant components of the recovery time are the time to save the replica's log and service state to disk, the time to reboot, and the time to check and fetch state. The other components are insignificant. The time to reboot is the dominant component for Andrew100 and checking and fetching state account for most of the recovery time in Andrew500 because the state is bigger.
Given these times, we set the period between watchdog timeouts, Tw, to 3.5 minutes in Andrew100 and to 10 minutes in Andrew500. These settings correspond to a minimum window of vulnerability of 4 and 10.5 minutes, respectively. We also run the experiments for Andrew100 with a 1s reboot and the maximum time to complete recovery in this case was 13.3s. This enables a window of vulnerability of 1.5 minutes with Tw set to 1 minute.
Recovery must be fast to achieve a small window of vulnerability. While the current recovery times are low, it is possible to reduce them further. For example, the time to check the state can be reduced by periodically backing up the state onto a disk that is normally write-protected and by using copy-on-write to create copies of modified pages on a writable disk. This way only the modified pages need to be checked. If the read-only copy of the state is brought up to date frequently (e.g., daily), it will be possible to scale to very large states while achieving even lower recovery times.
The results also show that the period between key changes, Tk, can be small without impacting performance significantly. Tk could be smaller than 15s but it should be substantially larger than 3 message delays under normal load conditions to provide liveness.
There are several reasons why recoveries have a low impact on performance. The most obvious is that recoveries are staggered such that there is never more than one replica recovering; this allows the remaining replicas to continue processing client requests. But it is necessary to perform a view change whenever recovery is applied to the current primary and the clients cannot obtain further service until the view change completes. These view changes are inexpensive because a primary multicasts a view-change message just before its recovery starts and this causes the other replicas to move to the next view immediately.
2
Two client machines had 700MHz PIIIs but were
otherwise identical to the other machines.
Next:Related
Work Up:Contents
Previous:Implementation
Miguel Castro and Barbara Liskov, "Proactive Recovery in a Byzantine-Fault-Tolerant System", in Proceedings of the Fourth Symposium on Operating Systems
Design and Implementation, San Diego, USA, October 2000.