The Andrew benchmark is used to compare BFS with two other file systems: one is the NFS V2 implementation in Digital Unix, and the other is identical to BFS except without replication. The first comparison demonstrates that our system is practical by showing that its latency is similar to the latency of a commercial system that is used daily by many users. The second comparison allows us to evaluate the overhead of our algorithm accurately within an implementation of a real service.
The interval between checkpoints was 128 requests, which causes garbage collection to occur several times in any of the experiments. The maximum sequence number accepted by replicas in pre-prepare messages was 256 plus the sequence number of the last stable checkpoint.
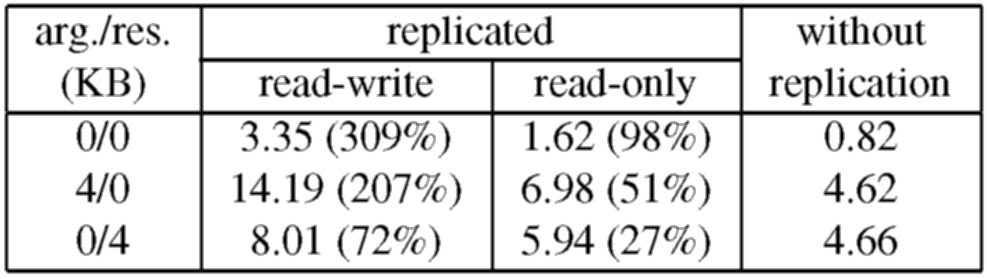
The overhead introduced by the replication library is due to extra computation and communication. For example, the computation overhead for the read-write 0/0 operation is approximately 1.06ms, which includes 0.55ms spent executing cryptographic operations. The remaining 1.47ms of overhead are due to extra communication; the replication library introduces an extra message round-trip, it sends larger messages, and it increases the number of messages received by each node relative to the service without replication.
The overhead for read-only operations is significantly lower because the optimization discussed in Section 5.1 reduces both computation and communication overheads. For example, the computation overhead for the read-only 0/0 operation is approximately 0.43ms, which includes 0.23ms spent executing cryptographic operations, and the communication overhead is only 0.37ms because the protocol to execute read-only operations uses a single round-trip.
Table 1 shows that the relative overhead is lower for the 4/0 and 0/4 operations. This is because a significant fraction of the overhead introduced by the replication library is independent of the size of operation arguments and results. For example, in the read-write 0/4 operation, the large message (the reply) goes over the network only once (as discussed in Section 5.1) and only the cryptographic overhead to process the reply message is increased. The overhead is higher for the read-write 4/0 operation because the large message (the request) goes over the network twice and increases the cryptographic overhead for processing both request and pre-prepare messages.
It is important to note that this micro-benchmark represents the worst case overhead for our algorithm because the operations perform no work and the unreplicated server provides very weak guarantees. Most services will require stronger guarantees, e.g., authenticated connections, and the overhead introduced by our algorithm relative to a server that implements these guarantees will be lower. For example, the overhead of the replication library relative to a version of the unreplicated service that uses MACs for authentication is only 243% for the read-write 0/0 operation and 4% for the read-only 4/0 operation.
We can estimate a rough lower bound on the performance gain afforded by our algorithm relative to Rampart [30]. Reiter reports that Rampart has a latency of 45ms for a multi-RPC of a null message in a 10 Mbit/s Ethernet network of 4 SparcStation 10s [30]. The multi-RPC is sufficient for the primary to invoke a state machine operation but for an arbitrary client to invoke an operation it would be necessary to add an extra message delay and an extra RSA signature and verification to authenticate the client; this would lead to a latency of at least 65ms (using the RSA timings reported in [29].) Even if we divide this latency by 1.7, the ratio of the SPECint92 ratings of the DEC 3000/400 and the SparcStation 10, our algorithm still reduces the latency to invoke the read-write and read-only 0/0 operations by factors of more than 10 and 20, respectively. Note that this scaling is conservative because the network accounts for a significant fraction of Rampart's latency [29] and Rampart's results were obtained using 300-bit modulus RSA signatures, which are not considered secure today unless the keys used to generate them are refreshed very frequently.
There are no published performance numbers for SecureRing [16] but it would be slower than Rampart because its algorithm has more message delays and signature operations in the critical path.
We use the Andrew benchmark to compare BFS with two other file system configurations: NFS-std, which is the NFS V2 implementation in Digital Unix, and BFS-nr, which is identical to BFS but with no replication. BFS-nr ran two simple UDP relays on the client, and on the server it ran a thin veneer linked with a version of snfsd from which all the checkpoint management code was removed. This configuration does not write modified file system state to disk before replying to the client. Therefore, it does not implement NFS V2 protocol semantics, whereas both BFS and NFS-std do.
Out of the 18 operations in the NFS V2 protocol only getattr is read-only because the time-last-accessed attribute of files and directories is set by operations that would otherwise be read-only, e.g., read and lookup. The result is that our optimization for read-only operations can rarely be used. To show the impact of this optimization, we also ran the Andrew benchmark on a second version of BFS that modifies the lookup operation to be read-only. This modification violates strict Unix file system semantics but is unlikely to have adverse effects in practice.
For all configurations, the actual benchmark code ran at the client workstation using the standard NFS client implementation in the Digital Unix kernel with the same mount options. The most relevant of these options for the benchmark are: UDP transport, 4096-byte read and write buffers, allowing asynchronous client writes, and allowing attribute caching.
We report the mean of 10 runs of the benchmark for each configuration. The sample standard deviation for the total time to run the benchmark was always below 2.6% of the reported value but it was as high as 14% for the individual times of the first four phases. This high variance was also present in the NFS-std configuration. The estimated error for the reported mean was below 4.5% for the individual phases and 0.8% for the total.
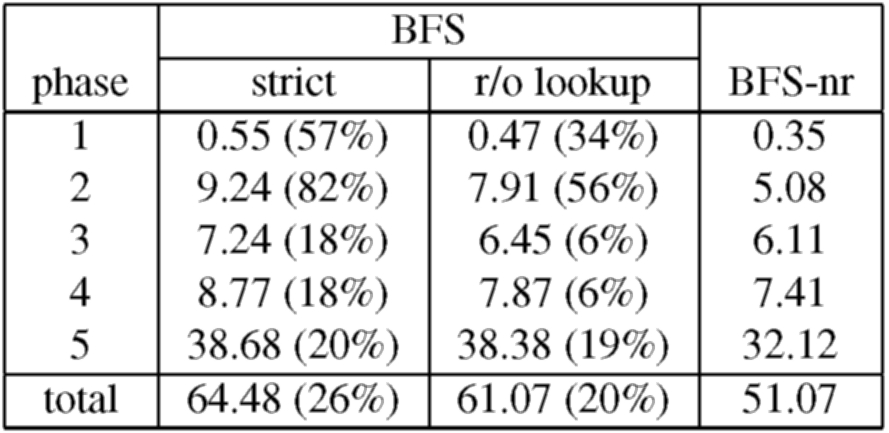
Table 2 shows the results for BFS and BFS-nr. The comparison between BFS-strict and BFS-nr shows that the overhead of Byzantine fault tolerance for this service is low - BFS-strict takes only 26% more time to run the complete benchmark. The overhead is lower than what was observed for the micro-benchmarks because the client spends a significant fraction of the elapsed time computing between operations, i.e., between receiving the reply to an operation and issuing the next request, and operations at the server perform some computation. But the overhead is not uniform across the benchmark phases. The main reason for this is a variation in the amount of time the client spends computing between operations; the first two phases have a higher relative overhead because the client spends approximately 40% of the total time computing between operations, whereas it spends approximately 70% during the last three phases.
The table shows that applying the read-only optimization to lookup improves the performance of BFS significantly and reduces the overhead relative to BFS-nr to 20%. This optimization has a significant impact in the first four phases because the time spent waiting for lookup operations to complete in BFS-strict is at least 20% of the elapsed time for these phases, whereas it is less than 5% of the elapsed time for the last phase.
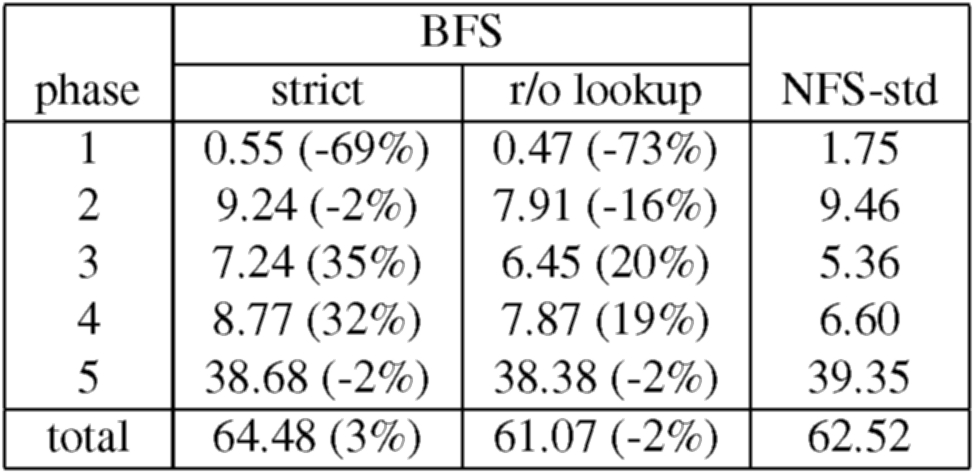
Table 3 shows the results for BFS vs NFS-std. These results show that BFS can be used in practice - BFS-strict takes only 3% more time to run the complete benchmark. Thus, one could replace the NFS V2 implementation in Digital Unix, which is used daily by many users, by BFS without affecting the latency perceived by those users. Furthermore, BFS with the read-only optimization for the lookup operation is actually 2% faster than NFS-std.
The overhead of BFS relative to NFS-std is not the same for all phases. Both versions of BFS are faster than NFS-std for phases 1, 2, and 5 but slower for the other phases. This is because during phases 1, 2, and 5 a large fraction (between 21% and 40%) of the operations issued by the client are synchronous, i.e., operations that require the NFS implementation to ensure stability of modified file system state before replying to the client. NFS-std achieves stability by writing modified state to disk whereas BFS achieves stability with lower latency using replication (as in Harp [20]). NFS-std is faster than BFS (and BFS-nr) in phases 3 and 4 because the client issues no synchronous operations during these phases.
Next: Related
Work Up: Contents Previous: Implementation